
2022 Update: H+T Index Release Notes
- Uses 2019 American Community Survey (ACS) data as input
- Uses 2019 Longitudinal Employer-Household Dynamics data
- Updated AllTransitTM data (uses 2018 to 2019 transit schedules)
- Enhanced transportation model including interaction variables
More information on the transportation cost model can be found in the Methods document, and a list of all transit agencies used in developing this index are found in Attachment A.
The Index shows that transportation costs vary between and within regions depending on neighborhood characteristics:
- People who live in location-efficient neighborhoods—compact, mixed-use, and with convenient access to jobs, services, transit and amenities—tend to have lower transportation costs.
- People who live in location-inefficient places—less dense areas that require automobiles for most trips—are more likely to have higher transportation costs.
The traditional measure of affordability recommends that housing cost no more than 30% of household income. Under this view, a little over half (55%) of US neighborhoods are considered “affordable” for the typical household. However, that benchmark fails to take into account transportation costs, which are typically a household’s second-largest expenditure. The H+T Index offers an expanded view of affordability, one that combines housing and transportation costs and sets the benchmark at no more than 45% of household income.
When transportation costs are factored into the equation, the number of affordable neighborhoods drops to 26%, resulting in a net loss of 59,768 neighborhoods that Americans can truly afford. The key finding from the H+T Index is that household transportation costs are highly correlated with urban environment characteristics, when controlling for household characteristics.
Methodology
The methods for the cost model are drawn from peer-reviewed research findings on the factors that drive household transportation costs. Throughout several iterations of the model’s development, the assumptions, calculations, and methods have been reviewed by practitioners at the Metropolitan Council in Minneapolis-St. Paul, fellows with the Brookings Institution, and academics from the University of Minnesota, Virginia Tech, Temple University, and the University of Pennsylvania who specialize in transportation modeling, household travel behavior, community indicators, and related topics.
More information on the transportation cost model can be found in the Methods document, and a list of all transit agencies used in developing this index are found in Attachment A.
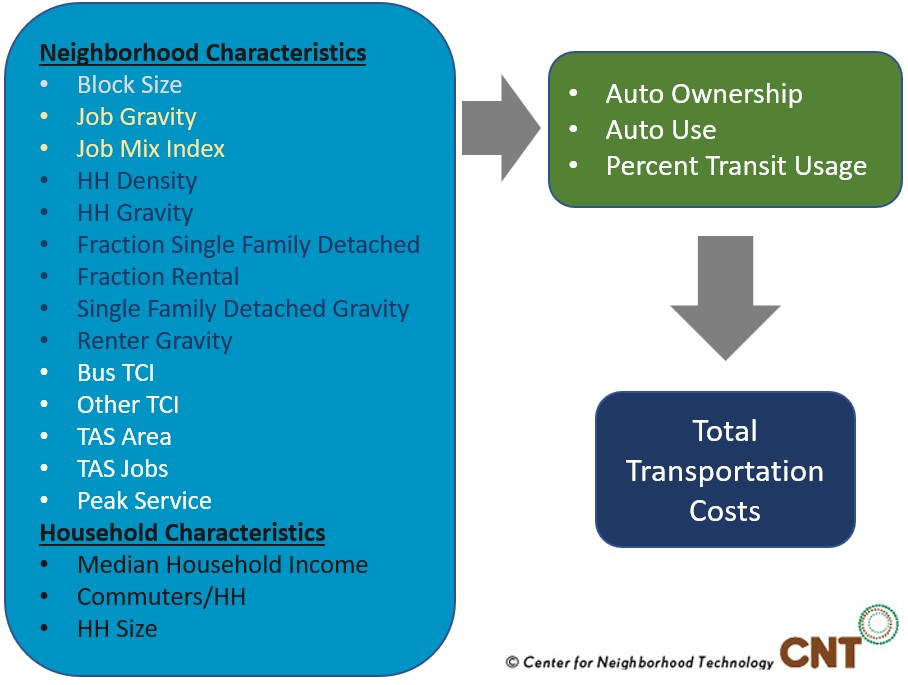
History
The H+T Index was initially developed for Minneapolis-St. Paul as a project of the Brookings Institution's Urban Markets Initiative. The 2006 report, The Affordability Index: A New Tool for Measuring the True Affordability of a Housing Choice, found that location matters, and it can affect the true cost of housing when transportation costs are factored in. This research found that two primary independent variables in the household transportation model—residential density and household income—drive three dependent variables related to household travel behavior: auto ownership, auto use, and transit ridership. Today the model controls for household characteristics to show the effect of the built environment on transportation costs. More information on the transportation cost model can be found in the Methods document, and a list of all transit agencies used in developing this index are found in Attachment A.
Several iterations of the Index expanded its geographic coverage, improved its model, and advanced its website functionality. Improvements made to the current version of the H+T Index include a simplification of the transportation cost model, use of auto ownership costs based on the Consumer Expenditure Survey, new website features, and more accessible data. The H+T Index is employed across the US by planners, affordable housing advocates, policy makers and others. More information on the use and implementation of the Index can be found on the Applications page.
Funders
CNT thanks its funders for their insightful and generous support for the development and expansion of the H+T Index:
- Brookings Institution Urban Markets Initiative/Living Cities
- Center for Housing Policy of the National Housing Conference
- Federal Transit Administration, United States Department of Transportation
- Field Foundation of Illinois
- Grand Victoria Foundation
- John D. and Catherine T. MacArthur Foundation
- Lloyd A. Fry Foundation
- McKnight Foundation
- Nathan Cummings Foundation
- Rockefeller Foundation
- Searle Funds at the Chicago Community Trust
- Surdna Foundation
- The Energy Foundation
- The Ford Foundation
- The Joyce Foundation
- U.S. Department of Housing and Urban Development
- Wallace Global Fund
- United States Department of Energy
- United States Environmental Protection Agency